Submersible Pump Performance Curve: Complete Guide
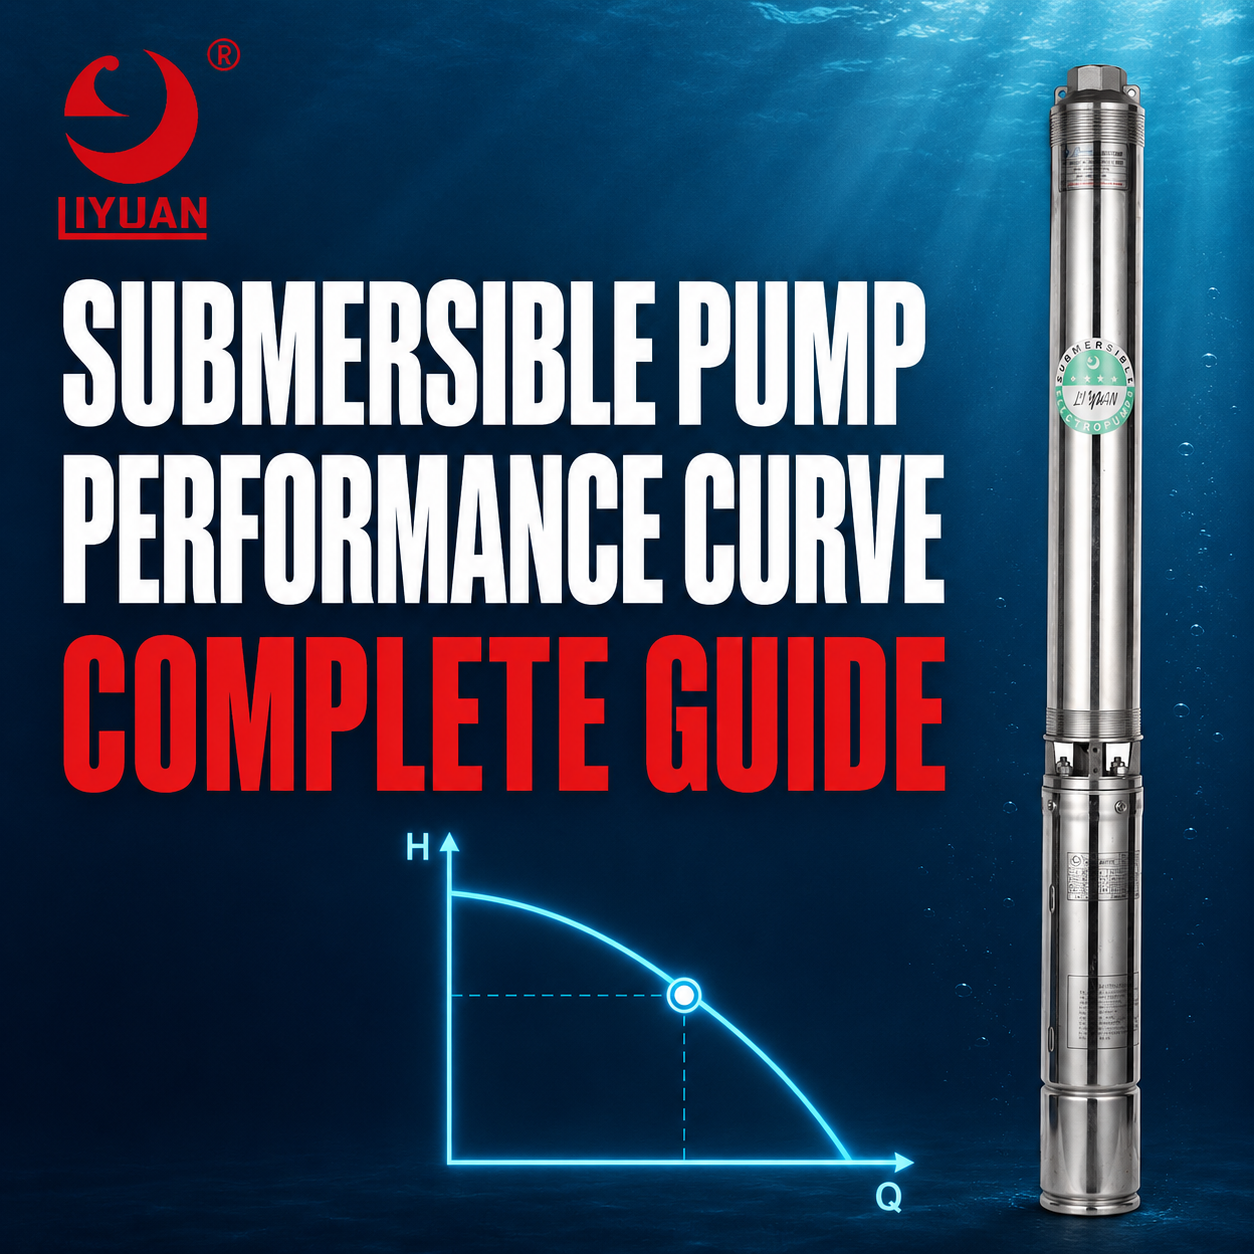
A Submersible Pump Performance Curve Shows How Much Flow, Head, Efficiency, And Power A Pump Produces Under Different Operating Conditions.
The Correct Pump Is Not Simply The Model With The Highest Flow Or Maximum Head. It Must Meet The Required Flow And Total Dynamic Head At The Same Point.
This Intersection Is Called The Duty Point Or Operating Point.
Ideally, The Duty Point Should Remain Near The Pump’s Best Efficiency Point And Inside The Manufacturer’s Recommended Operating Range.
What Is A Submersible Pump Performance Curve?
A Submersible Pump Performance Curve Is A Graph Based On Hydraulic Test Data.
It Shows How Pump Performance Changes As Flow Increases Or Decreases.
A Complete Curve May Include:
- Flow Rate
- Total Head
- Pump Efficiency
- Power Consumption
- Best Efficiency Point
- Minimum Flow
- Maximum Flow
- Recommended Operating Range
- Number Of Stages
- Impeller Diameter
- Rotational Speed
- Required Submergence
- NPSH Requirements
Pump Manufacturers Generate Curves For A Specific Pump Design, Speed, Frequency, Impeller, And Stage Configuration.
Do Not Use A Curve From A Similar-Looking Pump Unless The Model And Configuration Match.
What Do The Pump Curve Axes Show?
Horizontal Axis
The Horizontal Axis Usually Shows Flow Rate.
Common Units Include:
- Cubic Meters Per Hour
- Liters Per Minute
- Liters Per Second
- Gallons Per Minute
Flow Is Usually Represented By The Letter Q.
Vertical Axis
The Vertical Axis Usually Shows Total Head.
Common Units Include:
- Meters
- Feet
- Bar
- PSI
Head Is Often Represented By The Letter H.
The Main Head-Capacity Curve Is Commonly Called The Q-H Curve.
How Does The Flow-Head Curve Work?
A Centrifugal Submersible Pump Usually Produces Higher Head At Lower Flow.
As Flow Increases, Available Head normally decreases.
The Left Side Of The Curve Represents Lower Flow And Higher Head.
The Right Side Represents Higher Flow And Lower Head.
For Example, A Pump May Produce:
- 100 Meters At 5 m³/h
- 85 Meters At 10 m³/h
- 65 Meters At 15 m³/h
- 40 Meters At 20 m³/h
These Values Show Why Maximum Head And Maximum Flow Cannot Occur At The Same Duty Point.
The Submersible Pump Flow Rate Guide Explains How To Determine The Required System Flow.
What Is The Duty Point?
The Duty Point Is The Flow And Head The System Requires During Operation.
For Example:
Duty Point = 15 m³/h At 80 Meters TDH
The Pump Must Produce 15 m³/h While Overcoming 80 Meters Of Total Dynamic Head.
A Pump That Produces 15 m³/h At Only 50 Meters Cannot Meet This Requirement.
Likewise, A Pump That Produces 80 Meters At Only 5 m³/h Cannot Meet The Required Flow.
The Correct Curve Must Pass Through Or Near Both Values.
What Is The System Curve?
The System Curve Shows The Head Required By The Complete Pipeline At Different Flow Rates.
It Usually Includes:
- Static Lift
- Required Outlet Pressure
- Drop-Pipe Friction
- Discharge-Pipe Friction
- Valve Losses
- Fitting Losses
- Filter Losses
- Equipment Resistance
A Simplified System-Curve Relationship Is:
System Head = Static Head + K × Flow²
Static Head Remains Relatively Constant.
Friction Head Increases Rapidly As Flow Increases.
Therefore, The System Curve Usually Rises From Left To Right.
How Do The Pump Curve And System Curve Work Together?
The Actual Operating Point Occurs Where The Pump Curve Intersects The System Curve.
At This Point:
- Pump Head Equals System Head
- Pump Flow Equals System Flow
- Hydraulic Operation Reaches Equilibrium
The Pump Does Not Independently Choose Its Flow.
The Pipeline, Elevation, Pressure, Valves, And Pump Performance Determine The Final Operating Point Together.
If System Resistance Increases, The Operating Point Moves Toward Lower Flow.
If System Resistance Decreases, It Moves Toward Higher Flow.
How Does Total Dynamic Head Affect The Curve?
Total Dynamic Head Determines How Much Resistance The Pump Must Overcome.
TDH Includes:
- Pumping Water Level
- Delivery Elevation
- Required Pressure
- Pipe Friction
- Fitting Losses
- Filter Losses
The Total Dynamic Head For Submersible Pump Guide Explains The Complete Calculation Method.
Incorrect TDH Produces An Incorrect Operating Point.
What Is The Best Efficiency Point?
The Best Efficiency Point, Or BEP, Is The Flow And Head Where Pump Hydraulic Efficiency Reaches Its Maximum.
At BEP, Water Usually Enters And Leaves The Impeller With Reduced Turbulence And Flow Separation.
The Hydraulic Institute Pump FAQ Explains That Operating Near BEP Can Improve Pump Reliability And Reduce Wear.
A Pump Operating Near BEP Often Provides:
- Higher Efficiency
- Lower Vibration
- Better Hydraulic Stability
- Reduced Internal Recirculation
- Lower Bearing Stress
- Longer Component Life
The Duty Point Does Not Always Need To Sit Exactly At BEP. However, It Should Usually Remain Inside The Manufacturer’s Approved Range.
What Is The Preferred Operating Region?
The Preferred Operating Region, Or POR, Is The Flow Range Around BEP Where Efficiency And Reliability Remain Favorable.
Inside The POR, The Pump Usually Experiences:
- Stable Hydraulic Forces
- Lower Vibration
- Reduced Recirculation
- Better Bearing Loading
- Predictable Efficiency
- Longer Service Life
The Exact POR Depends On Pump Design And Applicable Standards.
Never Create A Universal Percentage Without Reviewing The Manufacturer’s Curve Or Technical Documentation.
What Is The Allowable Operating Region?
The Allowable Operating Region, Or AOR, Is A Wider Flow Range In Which The Pump Can Operate Without Exceeding Defined Limits.
Operation Inside The AOR But Outside The POR May Be Permitted.
However, Continuous Operation Far From BEP Can Reduce Efficiency And Reliability.
The Pump Manufacturer Should Specify:
- Minimum Continuous Flow
- Maximum Continuous Flow
- Preferred Operating Region
- Allowable Operating Region
How To Read The Efficiency Curve
The Efficiency Curve Usually Appears As A Rounded Or Hill-Shaped Line.
Efficiency Rises As Flow Approaches BEP.
It Reaches A Maximum Near BEP And Then Falls As Flow Moves Away.
Pump Efficiency Is:
Pump Efficiency = Hydraulic Output Power ÷ Pump Shaft Power × 100
Higher Efficiency Means Less Shaft Power Is Wasted As Hydraulic Loss, Heat, And Turbulence.
An Energy Efficient Submersible Pump Should Match Its Normal Duty Point Instead Of Offering High Peak Efficiency At An Unused Flow.
Pump Efficiency Vs. Motor Efficiency
1.Pump Efficiency And Motor Efficiency Are Different.
Pump Efficiency
2.Pump Efficiency Describes How Effectively The Pump Converts Shaft Power Into Hydraulic Power.
Motor Efficiency
Motor Efficiency Describes How Effectively The Motor Converts Electrical Input Power Into Mechanical Shaft Power.
Overall Efficiency
Overall Pumping Efficiency Includes Both Pump And Motor Performance.
A Simplified Relationship Is:
Overall Efficiency = Pump Efficiency × Motor Efficiency
For Example:
- Pump Efficiency: 70%
- Motor Efficiency: 85%
Overall Efficiency = 0.70 × 0.85 = 59.5%
Cable, VFD, Transformer, And Control Losses Can Reduce Complete System Efficiency Further.
How To Read The Power Curve
A Power Curve Shows The Shaft Power Or Input Power Required At Different Flow Rates.
Common Units Include:
- Kilowatts
- Horsepower
Do Not Assume Power Always Increases With Flow.
The Power-Curve Shape Depends On Pump Hydraulic Design.
Always Check The Actual Curve Across The Complete Operating Range.
The Selected Motor Must Handle The Maximum Required Pump Power Within The Approved Operating Region.
Hydraulic Power Formula
For Water:
Hydraulic Power = Density × Gravity × Flow × Head
When Using Cubic Meters Per Second:
Hydraulic Power In kW = ρ × G × Q × H ÷ 1000
A Convenient Water Formula Is:
Hydraulic Power In kW ≈ Q In m³/h × H In Meters ÷ 367
Example
Assume:
- Flow: 15 m³/h
- Head: 80 Meters
Hydraulic Power Is:
15 × 80 ÷ 367 = 3.27 kW
If Pump Efficiency Is 70%:
Required Shaft Power = 3.27 ÷ 0.70 = 4.67 kW
Motor Selection Must Also Consider Motor Efficiency, Service Factor, Temperature, Voltage, And The Maximum Power Across The Operating Range.
Why Motor Power Must Be Checked Across The Curve
A Motor That Handles The Design Point May Still Overload At Another Operating Point.
For Example, Opening A Valve Can Reduce System Head And Increase Pump Flow.
If Power Demand Rises With Flow, The Motor May Exceed Its Rated Current.
Check:
- Design Flow
- Minimum Expected Head
- Maximum Expected Flow
- Pressure-Tank Cut-In
- Pressure-Tank Cut-Out
- VFD Maximum Frequency
- Bypass Operation
- Emergency Conditions
A Submersible Pump Overload Protection System Should Protect The Motor, But Correct Hydraulic Selection Remains Essential.
What Is Shutoff Head?
Shutoff Head Is The Head Produced When Flow Approaches Zero.
It Is Located Near The Left End Of The Q-H Curve.
Shutoff Head Helps Determine:
- Maximum Potential Pressure
- Pipeline Pressure Rating
- Valve Pressure Rating
- Pressure-Tank Rating
- Relief-Valve Requirements
A Pump Should Not Operate At Shutoff For An Extended Period.
Low-Flow Operation Can Cause:
- Water Heating
- Internal Recirculation
- Vibration
- Bearing Stress
- Hydraulic Instability
- Motor Cooling Problems
What Is Runout?
Runout Is Operation Near The Far-Right Side Of The Pump Curve.
This Region Has High Flow And Low Head.
Runout Can Cause:
- Motor Overload
- Excessive Well Drawdown
- High Pipe Velocity
- Upthrust
- Vibration
- Poor Efficiency
- Sand Production
- Hydraulic Instability
A High Flow Deep Well Pump Must Remain Within Its Published Flow Limits.
What Is Minimum Continuous Flow?
Minimum Continuous Flow Is The Lowest Flow At Which The Pump Can Operate Continuously Without Excessive Heating Or Hydraulic Stress.
The Exact Value Depends On:
- Pump Design
- Motor Cooling
- Water Temperature
- Bearing Design
- Stage Design
- Installation Orientation
- Manufacturer Requirements
Do Not Use A Discharge Valve To Reduce Flow Below The Manufacturer’s Limit.
What Is Maximum Continuous Flow?
Maximum Continuous Flow Is The Highest Flow Approved For Continuous Operation.
It May Be Limited By:
- Motor Power
- Upthrust
- Pump Efficiency
- Well Yield
- Sand Production
- Pipe Velocity
- Bearing Load
- Cavitation
- Required Submergence
Maximum Flow On A Graph Is Not Automatically A Safe Continuous Operating Point.
How Stage Quantity Changes The Curve
A Multistage Submersible Pump Contains Several Impellers And Diffusers Connected In Series.
Adding Stages Generally Increases Head While Maintaining A Similar Flow Range.
For Identical Hydraulic Stages:
- One Stage Produces A Certain Head
- Two Stages Produce More Head
- Additional Stages Continue Increasing Head
However, The Final Curve Must Come From Manufacturer Test Data.
Do Not Multiply Maximum Single-Stage Head Without Checking Efficiency, Power, And Actual Stage Performance.
How Impeller Design Changes The Curve
The Impeller Determines How The Pump Adds Energy To Water.
Different Designs Produce Different Relationships Between:
- Flow
- Head
- Efficiency
- Power
- Thrust
Radial Impellers often suit higher-head, lower-flow applications.
Mixed-Flow Designs commonly support higher flow with different head characteristics.
The Submersible Pump Impeller Guide Explains How Impeller Geometry Affects Pump Performance.
How Frequency Changes The Pump Curve
Motor Speed Changes When Supply Frequency Changes.
A 50 Hz Pump Curve Cannot Be Used Directly For 60 Hz Operation Unless The Manufacturer Approves The Motor And Pump.
According To The Affinity Laws:
- Flow Changes Approximately In Proportion To Speed
- Head Changes Approximately With Speed Squared
- Power Changes Approximately With Speed Cubed
For Example, If Speed Falls To 80%:
- Flow Falls To Approximately 80%
- Head Falls To Approximately 64%
- Power Falls To Approximately 51%
These Relationships Are Approximate And Assume Similar Hydraulic Operation.
How A VFD Changes The Performance Curve
A VFD Creates Multiple Pump Curves At Different Speeds.
At Lower Frequency, The Curve Moves Downward And Left.
At Higher Frequency, It Moves Upward And Right.
The Operating Point Changes Where Each Speed Curve Intersects The System Curve.
A Variable Frequency Drive For Submersible Pump Can Maintain Pressure Or Flow As Demand Changes.
However, VFD Settings Must Respect:
- Minimum Frequency
- Maximum Frequency
- Motor Cooling
- Pump Thrust
- Maximum Power
- Well Yield
- Required Submergence
- Cable And Filter Requirements
How Water Level Changes The Duty Point
Deep Well Water Level Can Change During Operation.
High Water Level
A Higher Pumping Water Level Reduces Static Lift.
This Lowers System Head And May Increase Pump Flow.
Low Water Level
A Lower Pumping Water Level Increases Static Lift.
This Raises System Head And Reduces Pump Flow.
Select The Pump For The Expected Water-Level Range, Not One Measurement.
How Pressure-Switch Settings Change The Duty Point
A Fixed-Speed Pump With A Pressure Tank Operates Across A Pressure Range.
For A 40/60 PSI System:
- The Pump Starts Near 40 PSI
- The Pump Stops Near 60 PSI
The System Head Is Lower At Cut-In And Higher At Cut-Out.
Therefore, Pump Flow Is Usually Higher Near Cut-In And Lower Near Cut-Out.
Check The Pump Curve At Both Conditions.
How Pipe Friction Changes The Duty Point
Pipe Friction increases with flow.
If Pipe Diameter Becomes Smaller, The System Curve Becomes Steeper.
The Operating Point Then Moves Toward Lower Flow And Higher Pump Head.
If The Pipeline Becomes Larger, Friction Falls And The Operating Point May Move Toward Higher Flow.
This Change Can Overload A Pump Selected For A More Restrictive System.
How Valve Position Changes The Duty Point
Closing A Discharge Valve Adds Resistance.
The Operating Point Moves Left Toward Lower Flow.
Opening The Valve Removes Resistance.
The Operating Point Moves Right Toward Higher Flow.
Throttling Can Control Flow, But It Wastes Hydraulic Energy.
How Filter Loading Changes The Curve
A Clean Filter Has Lower Resistance.
As The Filter Collects Sand Or Sediment, Pressure Loss Increases.
The System Curve Moves Upward, Reducing Pump Flow.
A Pump System Should Meet Requirements At Both:
- Clean-Filter Condition
- Maximum Permitted Dirty-Filter Condition
How Pump Wear Changes Performance
Wear Can Reduce Pump Head And Efficiency.
Common Causes Include:
- Abrasive Sand
- Corrosion
- Cavitation
- Worn Impellers
- Damaged Diffusers
- Enlarged Internal Clearances
- Shaft Wear
- Bearing Wear
The Actual Pump Curve Gradually Moves Below The Original Catalog Curve.
Recording Flow, Pressure, Current, And Water Level Helps Identify Performance Loss.
How Sand Affects The Pump Curve
Sand Can Erode Impellers And Diffusers.
It Can Also Increase Mechanical Resistance Or Block Internal passages.
Possible Results Include:
- Reduced Head
- Reduced Flow
- Lower Efficiency
- Higher Current
- Vibration
- Bearing Wear
Use A Suitable Pump, Correct Well Development, And Water-Quality Testing For Abrasive Sources.
How To Read A Pump Curve Step By Step
Step 1: Determine Required Flow
Calculate Peak Demand, Daily Volume, Available Pumping Time, And Well Yield.
Step 2: Calculate Total Dynamic Head
Include Pumping Water Level, Elevation, Pressure, Pipe Friction, And Fitting Losses.
Step 3: Find The Duty Point
Locate Required Flow On The Horizontal Axis.
Locate Required Head On The Vertical Axis.
Mark Their Intersection.
Step 4: Compare The Duty Point With The Pump Curve
Confirm That A Pump Curve Passes Through Or Near The Duty Point.
Step 5: Check BEP And Operating Range
Confirm That The Duty Point Falls Within The Manufacturer’s Recommended Range.
Step 6: Check Pump Efficiency
Compare Efficiency At The Duty Point With Alternative Pump Models.
Step 7: Check Required Power
Confirm Shaft Power Across The Complete Expected Operating Range.
Step 8: Select The Motor
Check Motor Power, Voltage, Phase, Frequency, Service Factor, Temperature, And Control Method.
Step 9: Check Minimum And Maximum Conditions
Evaluate:
- Highest Water Level
- Lowest Water Level
- Clean Filter
- Dirty Filter
- Open Valves
- Closed Valves
- Cut-In Pressure
- Cut-Out Pressure
- Minimum VFD Speed
- Maximum VFD Speed
Step 10: Confirm Material And Application Limits
Check:
- Water Temperature
- Sand Content
- Corrosion
- Pump Diameter
- Well Diameter
- Installation Orientation
- Minimum Submergence
- Motor Cooling
Pump Curve Selection Example
Assume A System Requires:
- Flow: 15 m³/h
- TDH: 80 Meters
1.Pump A Produces:
- 15 m³/h At 80 Meters
- Efficiency Near 70%
- Duty Point Near BEP
- Shaft Power Within Motor Rating
2.Pump B Produces:
- 15 m³/h At 80 Meters
- Efficiency Near 58%
- Duty Point Near Maximum Flow
- Power Close To Motor Limit
Pump A Is Generally The Better Hydraulic Match.
However, The Final Decision Should Also Consider:
- Materials
- Motor Efficiency
- Water Quality
- Purchase Cost
- Service Availability
- Required Protection
- Complete Lifecycle Cost
How To Compare Two Pump Curves
Compare Both Pumps At The Same Duty Point.
Review:
| Curve Factor | Pump A | Pump B |
|---|---|---|
| Flow At Required Head | Confirmed | Confirmed |
| Efficiency At Duty | Higher Or Lower | Higher Or Lower |
| Distance From BEP | Near Or Far | Near Or Far |
| Shaft Power | Within Rating | Within Rating |
| Minimum Flow | Acceptable | Acceptable |
| Maximum Flow | Acceptable | Acceptable |
| Stage Quantity | Compare | Compare |
| Motor Size | Compare | Compare |
| Material | Compare | Compare |
Do Not Compare Pumps Only By Maximum Flow, Maximum Head, Or Motor Power.
How To Verify Performance After Installation
Measure:
- Pump Flow
- Discharge Pressure
- Pumping Water Level
- Motor Current
- Supply Voltage
- Motor Frequency
- Valve Position
Use The Measurements To Calculate Actual TDH.
Plot The Measured Point On The Manufacturer’s Curve.
A Large Difference May Indicate:
- Incorrect Pump Rotation
- Worn Impellers
- Blocked Intake
- Falling Water Level
- Pipeline Leakage
- Incorrect Frequency
- Blocked Filter
- Faulty Pressure Gauge
- Faulty Flow Meter
- Incorrect Curve
Common Pump-Curve Reading Mistakes
Selecting By Maximum Head
Maximum Head Usually Occurs Near Zero Flow.
It Does Not Represent Normal Pump Output.
Selecting By Maximum Flow
Maximum Flow Usually Occurs At Low Head.
It May Fall Outside The Recommended Operating Range.
Ignoring The System Curve
The Pump Curve Alone Cannot Determine Actual Flow.
Ignoring BEP
A Pump That Meets Flow And Head Far From BEP May Have Poor Reliability.
Ignoring The Power Curve
The Motor Can Overload At Conditions Away From The Design Point.
Using The Wrong Frequency
A 50 Hz Curve And 60 Hz Curve Produce Different Results.
Ignoring Stage Quantity
Different Stage Counts Produce Different Head Curves.
Ignoring Water-Level Changes
Changing Water Level Moves The System Curve And Duty Point.
Confusing Pump Efficiency With Motor Efficiency
These Values Measure Different Energy conversions.
Assuming Catalog Performance Never Changes
Wear, Sand, Corrosion, And Incorrect Installation Can Reduce Actual Performance.
Information Required For Curve Selection
Provide The Following Information To The Pump Manufacturer:
- Required Flow
- Total Dynamic Head
- Static Water Level
- Pumping Water Level
- Well Yield
- Well Diameter
- Pump Installation Depth
- Pipe Diameter
- Pipe Length
- Required Outlet Pressure
- Water Temperature
- Sand Content
- Supply Voltage
- Number Of Phases
- Frequency
- Control Method
- Daily Operating Hours
- Maximum Starts Per Hour
- Material Requirements
Complete Data Helps The Manufacturer Select The Pump, Motor, Stages, Cable, And Control Equipment.
Frequently Asked Questions
What Does A Submersible Pump Performance Curve Show?
It Shows The Relationship Between Flow, Head, Efficiency, And Power At A Defined Speed And Pump Configuration.
Where Is Flow Shown On A Pump Curve?
Flow Usually Appears On The Horizontal Axis.
Where Is Head Shown On A Pump Curve?
Head Usually Appears On The Vertical Axis.
What Is The Best Efficiency Point?
BEP Is The Flow And Head Where The Pump Reaches Its Highest Hydraulic Efficiency.
What Determines The Actual Pump Flow?
Actual Flow Occurs Where The Pump Curve Intersects The System Curve.
Is Maximum Head The Best Operating Point?
No. Maximum Head Usually Occurs Near Zero Flow And May Not Support Continuous Operation.
Can A Pump Operate To The Right Of BEP?
It May Operate Within The Manufacturer’s Allowable Range. Excessive Right-Side Operation Can Cause Overload, Upthrust, And Reduced Efficiency.
Can A Pump Operate To The Left Of BEP?
It May Operate Within Approved Limits. Extreme Low-Flow Operation Can Cause Heating, Recirculation, And Vibration.
Does Adding Stages Increase Flow?
Adding Identical Stages Mainly Increases Head. The Hydraulic Flow Range Usually Remains Similar.
Does A Larger Motor Increase Pump Flow?
Not By Itself. Flow Depends On The Pump Hydraulics, Speed, And System Head.
Choose A Correctly Matched Submersible Pump From Liyuan
Liyuan Manufactures Submersible Pumps, Deep Well Motors, Solar Pump Systems, And Control Solutions For Residential, Agricultural, Commercial, Municipal, And Industrial Applications.
Liyuan Can Select A Pump According To:
- Required Flow
- Total Dynamic Head
- Well Yield
- Pumping Water Level
- Pump Curve
- Water Quality
- Motor Voltage
- Control Method
Complete Hydraulic Data Allows Liyuan To Match The Pump, Motor, Stages, Cable, And Controller Correctly.
Conclusion
A Submersible Pump Performance Curve Shows How Flow, Head, Efficiency, And Power Change Across The Pump’s Operating Range.
The Correct Duty Point Is Where The Pump Curve Intersects The System Curve.
Always Select The Pump At The Required Flow And Total Dynamic Head.
Then Confirm Efficiency, Motor Power, BEP, Minimum Flow, Maximum Flow, Stage Quantity, Water-Level Changes, And VFD Speed Range.
Correct Curve Selection Prevents Low Flow, Motor Overload, Excessive Energy Consumption, Hydraulic Instability, And Premature Pump Failure.
Email:Liyuan@liyuan-pump.com
WhatsApp:+86 181-2828-2767